
Nvidia’s “on fire.” But the blaze wasn’t started by the A.I. igniter. Here’s our take for the taking.
Let’s face it. Some human beings can truly rock. Some people’s capacity to turn brilliant ideas into reality, create life-saving medicines and advancements in technology, art, science, and finance that foster the wellbeing and betterment of present and future generations — it’s staggering.
Then again… it took 70 years since fitted sheets were invented in 1959 for someone to figure out that sewing a “top” and “side” label onto said sheets would save both the time and sanity of bed makers everywhere.
Which is to say, sometimes we get it really right, with shocking speed. And other times, we continue doing the old thing, even though it’s causing more harm than good, until a lightbulb goes off and there’s a better way staring us right in the face.
Take, for example, “fundamental” market analysis, which asserts that price trends are driven by the tenor of news events. Positive news causes prices to rise, while negative news begets declines.
This strategy has endured since the time of Buttonwood trees, persisting as the go-to model for navigating markets. But often, traders and investors using “fundamentals” end up as frustrated as we used to get trying to put the old, unlabeled fitted sheets onto a bed.
They think they’ve secured a corner of the market with a headline news event, only for prices to move the opposite way, causing the proverbial “fitted sheet” (i.e., trading plan) to fling off and hit them across the cheek. Or, as is the case for one of the world tech leaders NVIDIA Corp. (Nasdaq: NVDA). When the tech company soared to record highs on August 29, mainstream experts cited one catalyzing event: A.I. fervor.
That explanation certainly fits, but it’s not complete. It’s limited in scope to the time when A.I. enthusiasm went from “huh, does this thing really have legs?” to “oh it not only has legs, but it’s taking off running!” — also known as the day Chat GPT debuted on November 30, 2022.
But NVDA enjoyed a neck-craning rally — from $35 in 2019 to over $329 per share on Nov. 14, 2021 — long before Chat GPT went live. In turn, the A.I. fervor fire is only half the story.
Which is where Elliott wave analysis comes in to provide the full picture.
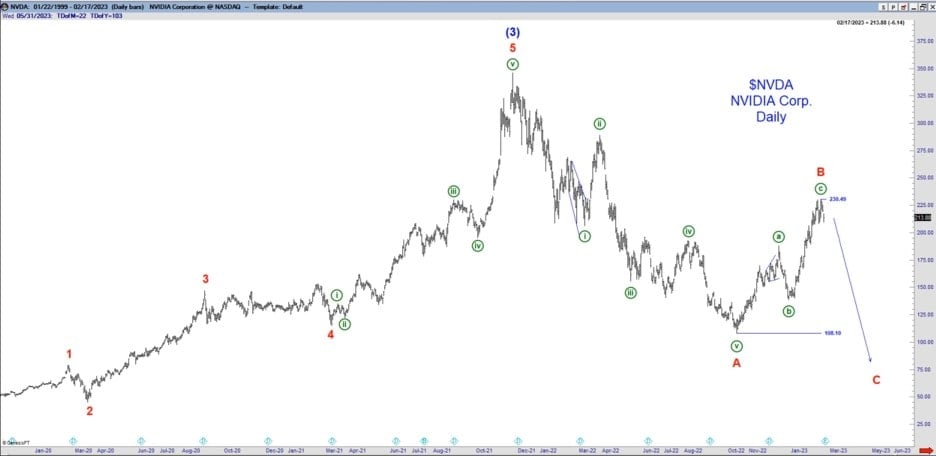
Here, we look at the February 21 Trader’s Classroom, where editor Robert Kelley showed a bearish wave count for NVDA. However, unlike “fundamentals,” which works linearly from point A (news event) to point B (price move), Elliott wave analysis works spatially to see all possible scenarios for price action. In Robert’s words from the February 21 Trader’s Classroom:
“Now what if this isn’t right. I always like to ask myself, ‘Where am I wrong?’
“What would be the alternate count? This is a corrective decline and NVDA has made a big low. If this is the case, 195.48 would be good support. If it holds there, this would turn the picture bullish and NVDA is headed to new highs.”
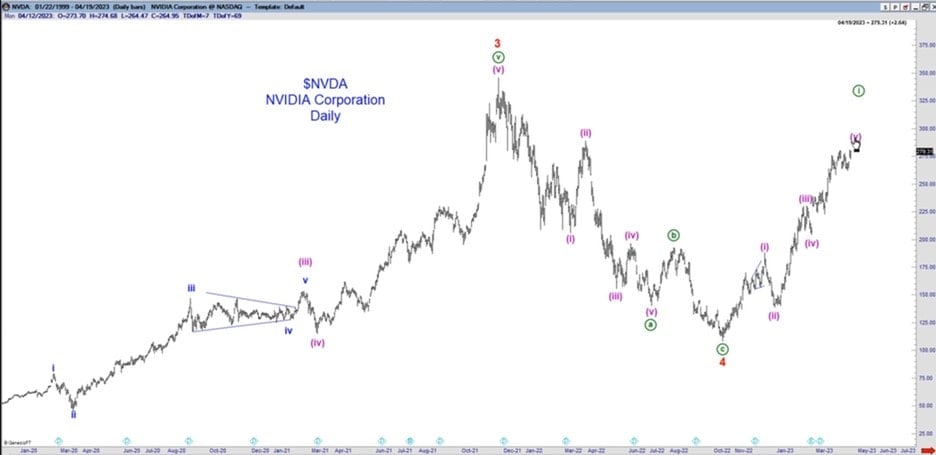
NVDA did hold the 195 level and turned up in an unstoppable rally. On April 20, Trader’s Classroom revisited the stock and said the runway for further strength was clear:
“I’m picking this stock because it has, right now, the 7th largest market cap in the world. It’s got impact on the indexes, it’s very liquid, it moves and in the long term, it’s been going up and tracing out some nice Elliott wave patterns here. So, maybe we can put our craft to use here.
“Prices should not get below 251. We’ve got four, 1-2’s here, so if you buy into this wave count, the implication is NVDA is going to see 4 and 5’s to the upside and this stock is going to be in an uptrend for quite some time.”
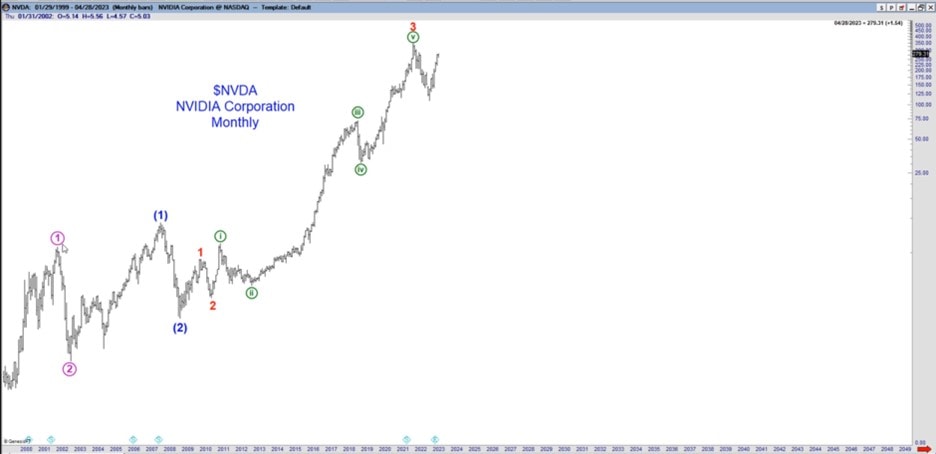
Robert also showed this longer-term chart of NVDA and said:
“The long-term on NVDA is bullish. I think there’s some kind of pullback that’s likely to happen, so I’d wait for some kind of reaction on the downside before jumping in on this.”
Prices dropped into April 25 but then reclaimed the upside to record highs on August 29. On Sept. 6, Barron’s uttered the name that shall not be spoken regarding NVDA:
“Nvidia Stock’s Blockbuster Gain Is a ‘Big Market Delusion.’ Artificial intelligence is a bubble waiting to pop.
If we know anything about bubbles, it’s that knowing one exists doesn’t make it easier to predict when it’s going to end. Only a clear, objective understanding of the wave patterns underway on the price charts of the market’s propped up by said bubbles, can.
Of course, not all Elliott wave interpretations of price action turn out to be right. But, as these two Trader’s Classroom lessons on NVDA show, Elliott analysis can identify the critical price levels that minimize risk every step of the way.
So click here if you’re not a robot and proceed to change the way you navigate the world’s leading markets.
Trading Lessons (Plus, Market Opportunities): 2 for 1
3 times a week, press “Play” and watch the instructor Robert Kelley explain in comprehensive detail how to recognize the relevant Elliott wave patterns (and supporting technical indicators) underway now and in the future.
This is every Trader’s Classroom video in a nutshell: a lesson, often with a new opportunity.
Here’s how to watch the latest lessons now.
Chat GBT applications. NVDA soared before A.I. enthusiasm took off with. Catapulted it from possibility to reality. Turning point in November similar applications since then.