Welcome to the Waveopedia!
Elliott wave analysis does not have to be complicated. Ralph Nelson Elliott, the father of the Elliott Wave Principle, identified only a few basic price patterns. Waveopedia is a comprehensive index of these Elliott wave patterns and terms. It’ll guide you as you learn how to apply the waves in your investing and trading.
Everyone from beginners to experts can benefit from Waveopedia. This index will ultimately help you to recognize wave patterns in price charts and understand the key rules and guidelines of Elliott wave. Simply click the tabs on the lefthand sidebar to view the entries.
If you’re new to the Elliott Wave Principle, we provide a simple description of the theory below and explain how you can use it to your benefit.
What Is the Elliott Wave Principle and How Can I Use It?
The Elliott Wave Principle is Ralph Nelson Elliott’s discovery that investor behavior, or crowd psychology, is not random or unpredictable. On the contrary, it trends and reverses in recognizable, repeating patterns on all degrees of trend and in all liquid markets, from stocks to commodities to cryptocurrencies. Using stock market data as his main research tool, Elliott isolated 13 patterns of movement, or “waves,” that recur in market price data. He named, defined and illustrated those patterns. He then described how they link together to form larger versions of themselves, and how those in turn link to form identical patterns of the next larger size — all the way from intraday charts to wave patterns that span centuries of market data.
In a nutshell, then, the Elliott Wave Principle is a catalog of price patterns. Once you know what pattern is underway right now, you can then make a probability-based forecast as to which pattern should come next, thus predicting the overall path of market progress, in a bull or bear market.
Pattern Analysis
The idea that market prices are patterned was intensely controversial just a few years ago. But no longer. Recent discoveries have confirmed that patterns exist in many natural systems — even systems that previously appeared to be random. Examples include the weather, botany, geography and even human physiology.
Generally, these systems unfold in patterns of “punctuated growth” — that is, periods of alternating growth and non-growth, or even decline. The patterns then build on themselves to form similar designs at a larger size, and then the next size up, and so on.
This emerging science is called “fractal geometry.” It is one of the most exciting branches of Chaos Theory.
And it is precisely the model identified by R.N. Elliott some 60 years ago in the financial markets.
The Basic Pattern
The basic pattern Elliott described consists of “motive waves” and “corrective waves.” A motive wave is composed of five subwaves. It moves in the same direction as the trend of the next larger size. A corrective wave is divided into three subwaves. It moves against the trend of the next larger size.
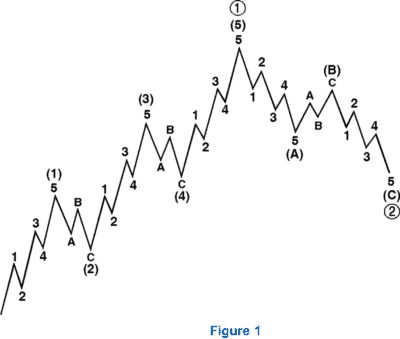
As Figure 1 shows, these basic patterns build to form five- and three-wave structures of increasingly larger size (larger “degree,” as Elliott said).
In the above illustration, waves1, 2, 3, 4 and5 together complete a larger motive wave sequence, labeled wave (1). The structure of wave (1) tells us that the movement at the next larger degree of trend is also upward. It also warns us to expect a three-wave correc tion — in this case, a downtrend. That correction, wave (2), is followed by waves (3), (4) and (5) to complete a sequence of the next larger degree, labeled as wave 1. At that point, again, a three-wave correction of the same degree occurs, labeled as wave 2.
Note that regardless of the size of the wave,each wave one peak leads to the same result — a wave two correction.
Within a corrective wave, subwaves A and C are usually smaller-degree motive waves. This means they too move in the same direction as the next larger trend. (In Figure 2 below, waves A and C are in the same direction as the larger wave (2).) Note that because they are motive, they themselves are made up of five subwaves. Waves labeled with a B, however, are corrective waves; they move in opposition to the trend of the next larger degree (in this case, they move upward against the downtrend). These corrective waves are themselves made up of three subwaves.
Applying the Elliott Wave Principle
So, in applying the Elliott Wave Principle, the analyst’s first task is to look at charts of market action and identify any completed five-wave and three-wave structures. Only then can he interpret where the market is and where it’s likely to go.
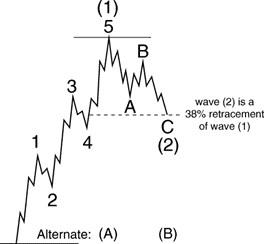
Say we’re studying a market that has reached the point shown in Figure 2. So far we’ve seen a five-wave move up, followed by a three-wave move down.
But this is not the only possible interpretation. It is also possible that wave (2) hasn’t ended yet; it could develop into a more complex three-wave structure before wave (3) gets underway. Another possibility is that the waves labeled (1) and (2) are actually waves (A) and (B) of a developing three-wave upward correction within a larger downtrend, as shown in the “Alternate” interpretation at the bottom of the chart. According to each of these interpretations though, the next imminent movement is likely to be upward.
This illustrates an important point concerning the Wave Principle. It does not provide certainty about any one market outcome. Instead, it gives you an objective means of determining the probability of a future direction for the market. At any time, two or more valid wave interpretations usually exist. So it’s important for any investor or trader to carefully assess the probability of each interpretation.
View the Elliott Wave Principle as your road map to the market and your investment idea as a trip. You start the trip with a specific plan in mind, but conditions along the way may force you to alter your course. Alternate counts are simply side roads that sometimes end up being the best path.
Elliott’s highly specific rules keep the number of valid interpretations (or “alternate counts”) to a minimum. The analyst usually considers as “preferred” the one that satisfies the largest number of guidelines. The top “alternate” is the one that satisfies the next largest number of guidelines, and so on. Alternates are an essential part of using the Wave Principle.
Elliott’s rules give specific “make-or-break” levels for a given interpretation. In Figure 2, for example, if the move labeled wave (2) continues below the level of the beginning of wave (1), then the originally preferred interpretation would be instantly invalidated.
By eliminating subjectivity, the rules help you firm up your investment strategy — and reduce your risk.
Conclusion
The Elliott Wave Principle enables you to properly decipher the wave patterns unfolding in each stock market and then make predictions on which wave patterns are most likely to occur next — this is the basis of Elliott wave analysis.
Each Elliott wave structure carries with it unique personality traits and is followed by another specific and unique structure. Studying these patterns eventually allows analysts to be able to predict both what may occur next, and — possibly even more importantly — what won’t happen next. By using the Elliott Wave Principle, you identify the highest probable moves with the least risk.
Elliott wave analysis requires patience and diligence, but it is very simple to employ.