
I have always been a “who cares about the odds” kinda person. Meaning, if someone tells me the likelihood of succeeding at, say, learning to skateboard at 40, are low, it just makes me want to try it more. Otherwise, why would I say yes to a marriage proposal to someone I met online, who lives in a farm in rural Georgia, 3 months into us dating amidst a global pandemic?
If you believe Wall Street’s statistics about the odds of success as a trader, yet still choose to speculate in the financial markets anyway, a part of you must be of that same “odds-schmods” mindset. Because according to the mainstream experts, the probability of traders losing money in the long run is between an abysmal 85% and 95%.
Are markets simply too unpredictable? Are price trends too random? Are “nefarious practices” of some traders throwing the entire system off track? Is making a profit at trading simply a matter of luck?
If anyone has the answer to these questions, it’s a 25-year veteran of technical market analysis, Jeffery Kennedy. For a quarter century, Jeffrey helmed the wheel for a multitude of educational publications and services here at Elliott Wave International, where he brought his decades of wisdom and hard-won lessons to bare for a generation of traders and investors alike.
Jeffrey confronted the validity of the 95% failure rate with this counterclaim: 80% of the time, active traders and investors select a winning position. In other words, most of the time all checkered flags are a “go.” The failure rate starts to creep up when traders stay in the market too long with the expectation of turning a “good enough” profit into a cinematic windfall.
In other words, the problem isn’t an irrational market. All too often, it’s investors and traders’ irrational greed. And the antidote to greed is discipline to avoid one common mistake.
For Jeffrey, there is one discipline that goes above all others to facilitate successful set-ups. Before we say it out loud, let’s see if you can figure it out from this pair of Elliott wave lessons from Jeffrey’s EWI archives.
First, Big Board sports apparel pacesetter Nike, Inc. (NKE).
On December 16, 2021, Jeffrey presented this chart of NKE, which showed prices engaged to the downside after having completed a five-wave rally. From EWI’s Trader’s Classroom lesson on Dec. 16:
“If we have indeed finished a larger five wave move up from the 2020 low, then we’re looking to head all the way back down to 125.”
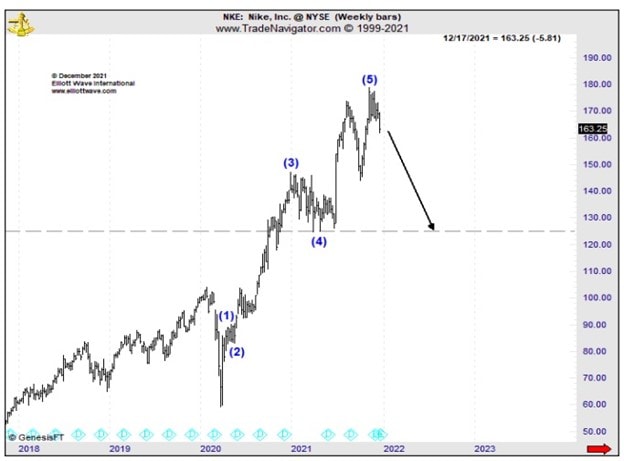
From there, Nike deflated like an Air Jordan basketball on a bed of nails, plummeting below 125 in May 2022 and continuing to fall before staging a small rebound into August of last year. Then, on August 31, Trader’s Classroom revisited Nike Inc. to confirm the rebound had unfolded as a countertrend move, and the current weakness was likely to continue. Jeffrey explained:
“The selloff that began in late 2021 is still very much in force.
“Wave patterns support the idea of further decline in Nike down to below 92.20.”
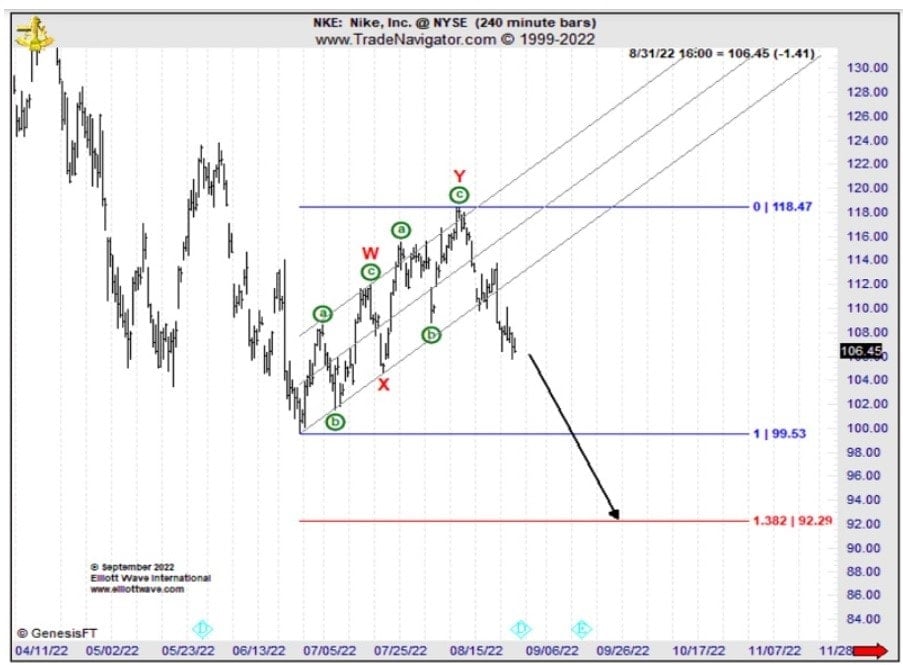
From there, NKE persisted lower, reaching Jeffrey’s downside objective of 92.20 — and then some — late last September.
The second market from Jeffrey’s annals isn’t a stock, but rather a commodity. In the June 2022 Monthly Commodity Junctures (now Commodity Junctures), Jeffrey showed this chart of feeder cattle. Prices had been rallying off a late spring low, and Jeffrey’s analysis called for further advance, into 2023.
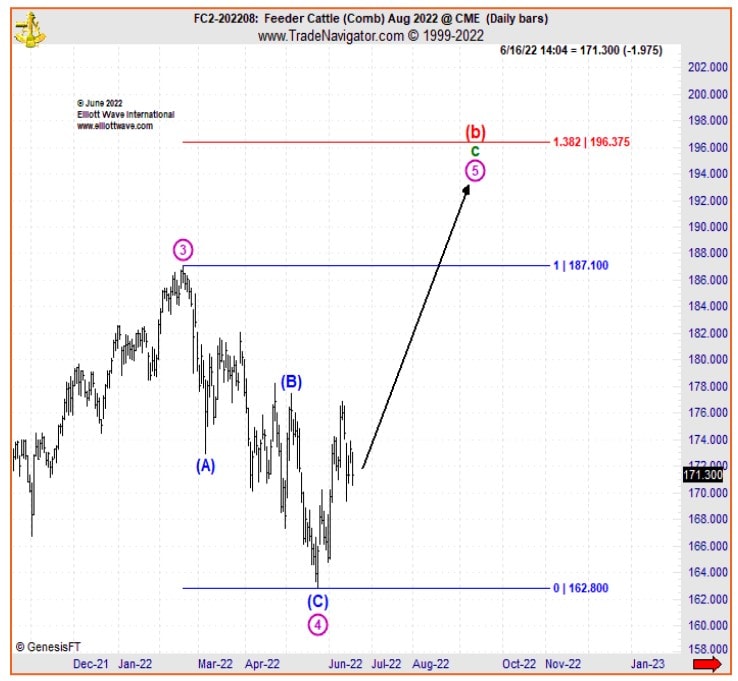
From there, feeder prices took off like a rocket into record high territory, which they continue to orbit as of now, in August 2023.
So, what common feature do you notice about these two examples?
The answer: Their price trends were underway before Jeffrey introduced high-confidence set-ups. Which brings us full circle back to the no. 1 discipline he sees as being crucial for successful trades: Do not pick tops and bottoms.