
An answer you won’t hear on Wall Street: A bullish Elliott wave set-up in commodities took hold in late 2020 — and the rest is (an expensive) history
For the last four years, going to the grocery store has caused many shoppers to breathe into a paper bag in anxious anticipation of the cost of common household staples – that is, until the paper bags themselves became too expensive.
Recently, the cost of orange juice concentrate surpassed that of olive oil (April 8 CCN). Meanwhile, since 2020 the cost of everything from eggs to milk has skyrocketed, sugar prices soared to 11-year highs in 2023, along with live cattle prices at record highs, coffee at decade highs, and on and on.
It’s the same over in Europe. This infographic from the Daily Mail UK on June 26 shows the across-the-food-board surge and reports that “food prices have risen by 20% in the last five years, according to Labor Department data”:

Adds CNBC on June 17, “80% of Americans say grocery costs have notably increased since the pandemic started.”
As for what fueled the food price crisis in the first place, mainstream experts are unanimous: the pandemic-induced surge in inflation. (To be fair, there are a multitude of “market fundamentals” economists use to explain mounting food costs, from supply restrictions to corporate manipulation. But, at the end of the day, they all agree the surge started with the pandemic – which, for a whole boatload of reasons, caused inflation to soar and food prices to follow.)
But that’s not totally accurate. For one, the U.S. annual rate of inflation has fallen steeply from its 40-year high of 9.1% in June 2022 to its May 2024 rate of 3.3%. Yet, food prices have continued to rise.
Delving further, the Covid pandemic began in March 2020, the same month the Bloomberg Commodity Index hit bottom. That was ironic, because that same month, mainstream experts foresaw a bearish “shock like no other” for the commodities sector. Supply bottlenecks, cratering demand, shuddered factories, oil prices in negative territory, live cattle prices at a decade low, abandoned crop fields, and so on scrambled the popular powers of prognostication. Wrote The Economist on April 27, 2020:
“Oil and Commodity Prices Are Where They Were 160 Years Ago…Don’t bother looking for a long-term trend; forecasting commodity prices is a mug’s game.”
But in our February 2020 Global Market Perspective – prior to “Covid” becoming a household word, prior to global panic or marooned cargo ships or deserted corn fields – our analysts showed this price chart of the Bloomberg Commodity Index. It placed the 2020 decline into a much different context than that of “fundamental market analysis.”

Ours was Elliott wave analysis; it states that price mirrors group investor psychology, which swings from excessive optimism to pessimism and back again, forming repeating patterns on price charts. These patterns, not the news or any subjective thought or feeling about the future – are the final arbiter of market trends.
The February 2020 Global Market Perspective identified the downtrend as part of a larger bear market that began at the 2008 peak, itself a 3-wave, A-B-C correction of the entire bull market since the 1960s.
Corrections don’t unfold in a vacuum. Their form is governed by the “Guideline of the Depth of Corrective Waves,” which states that fourth waves “tend to register their maximum retracement within the span of travel of the previous fourth wave of one lesser degree, most commonly near the level of its terminus.”
Applied here, our February 2020 Global Market Perspective had a high-confidence endpoint for the developing decline and wrote:
“The commodity index is likely to continue falling at least 15-20% to the 60-64 range—which represents the lows of previous fourth waves of lesser degree, where corrections often end.”
One month later, the March 2020 Global Market Perspective showed that the Bloomberg Commodity Index had fulfilled the “minimum requirements to complete wave (5) of C down.” It wrote:
“If the index were to rally back to their January 2020 highs, we would consider bullish scenarios for the entire commodities complex.”
From there, the index began to show its strength. The September 2020 Global Market Perspective confirmed that “commodities overall have ended their secular bear market from 2008.”
Next, the November 2020 Global Market Perspective warned: “Food prices have begun a long-term bull market”
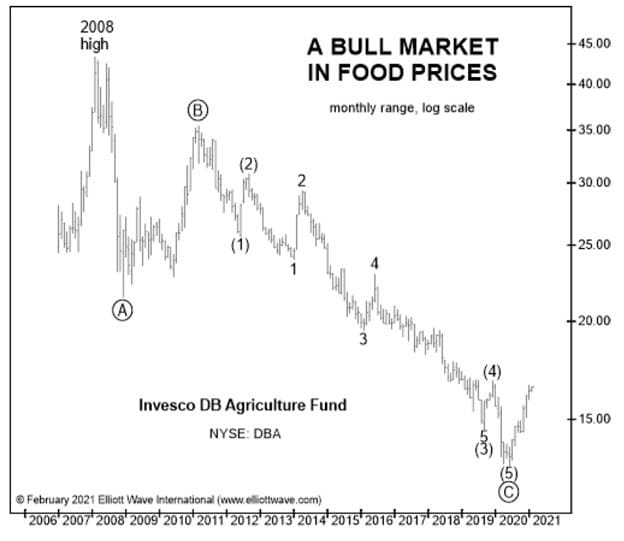
And rounding out the bases, the February 2021 Global Market Perspective introduced a chart of the Big Board listee and food commodities bellwether Invesco DB Agriculture Fund; its components include corn, soybeans, wheat, sugar, cocoa, coffee, cotton, live cattle, and lean hogs.
Our analysis was clear: “The ETF is in a long-term bull market.”
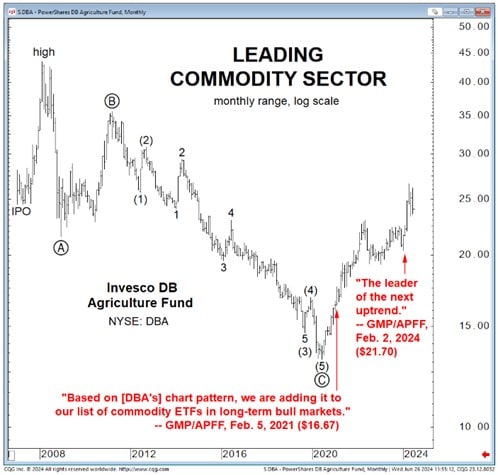
And this is what has followed: The Bloomberg Commodity Index soared to its highest level since 2008 in June 2022, while the Invesco DB Agriculture Fund has continued to catapult higher reflective in the ongoing rise in food prices. The DBA’s most recent upsurge occurred in February 2024, shown below:
This just in: On Friday, June 28, the brand-new, July 2020 Global Market Perspective will be released online. It shows you a brand-new labeled price chart and in-depth analysis of both the Invesco DB Commodity Fund and Invesco DB Agriculture Fund.
This is an opportunity for investors to see these markets, and their long-term price trends, through the objective Elliott wave lens and prepare for the next major shift in these commodities and their ultimate effect on the cost of food everyone puts on their table.
A Publication for Every Investor’s Needs
Before the bullish reversal in commodity and food prices, our Global Market Perspective subscribers were ready. Similarly, if you need our latest big-picture forecasts for leading financial markets in stocks, bonds, metals, energy, and more – 50+ markets in total – Global Market Perspective delivers all that too, directly to your screen once a month for just $59.
A Publication for Every Investor’s Needs
Before the bullish reversal in commodity and food prices, our Global Market Perspective subscribers were ready. Similarly, if you need our latest big-picture forecasts for leading financial markets in stocks, bonds, metals, energy, and more – 50+ markets in total – Global Market Perspective delivers all that too, directly to your screen once a month for just $77.