Main Street investors say they’re nervous about the stock market. Yet, they simply can’t resist “buying the dip.” Chalk it up to a remarkable years-long trend of optimism. That doesn’t go away overnight. Our April Elliott Wave Financial Forecast explains why you should watch what investors do, not what they say:
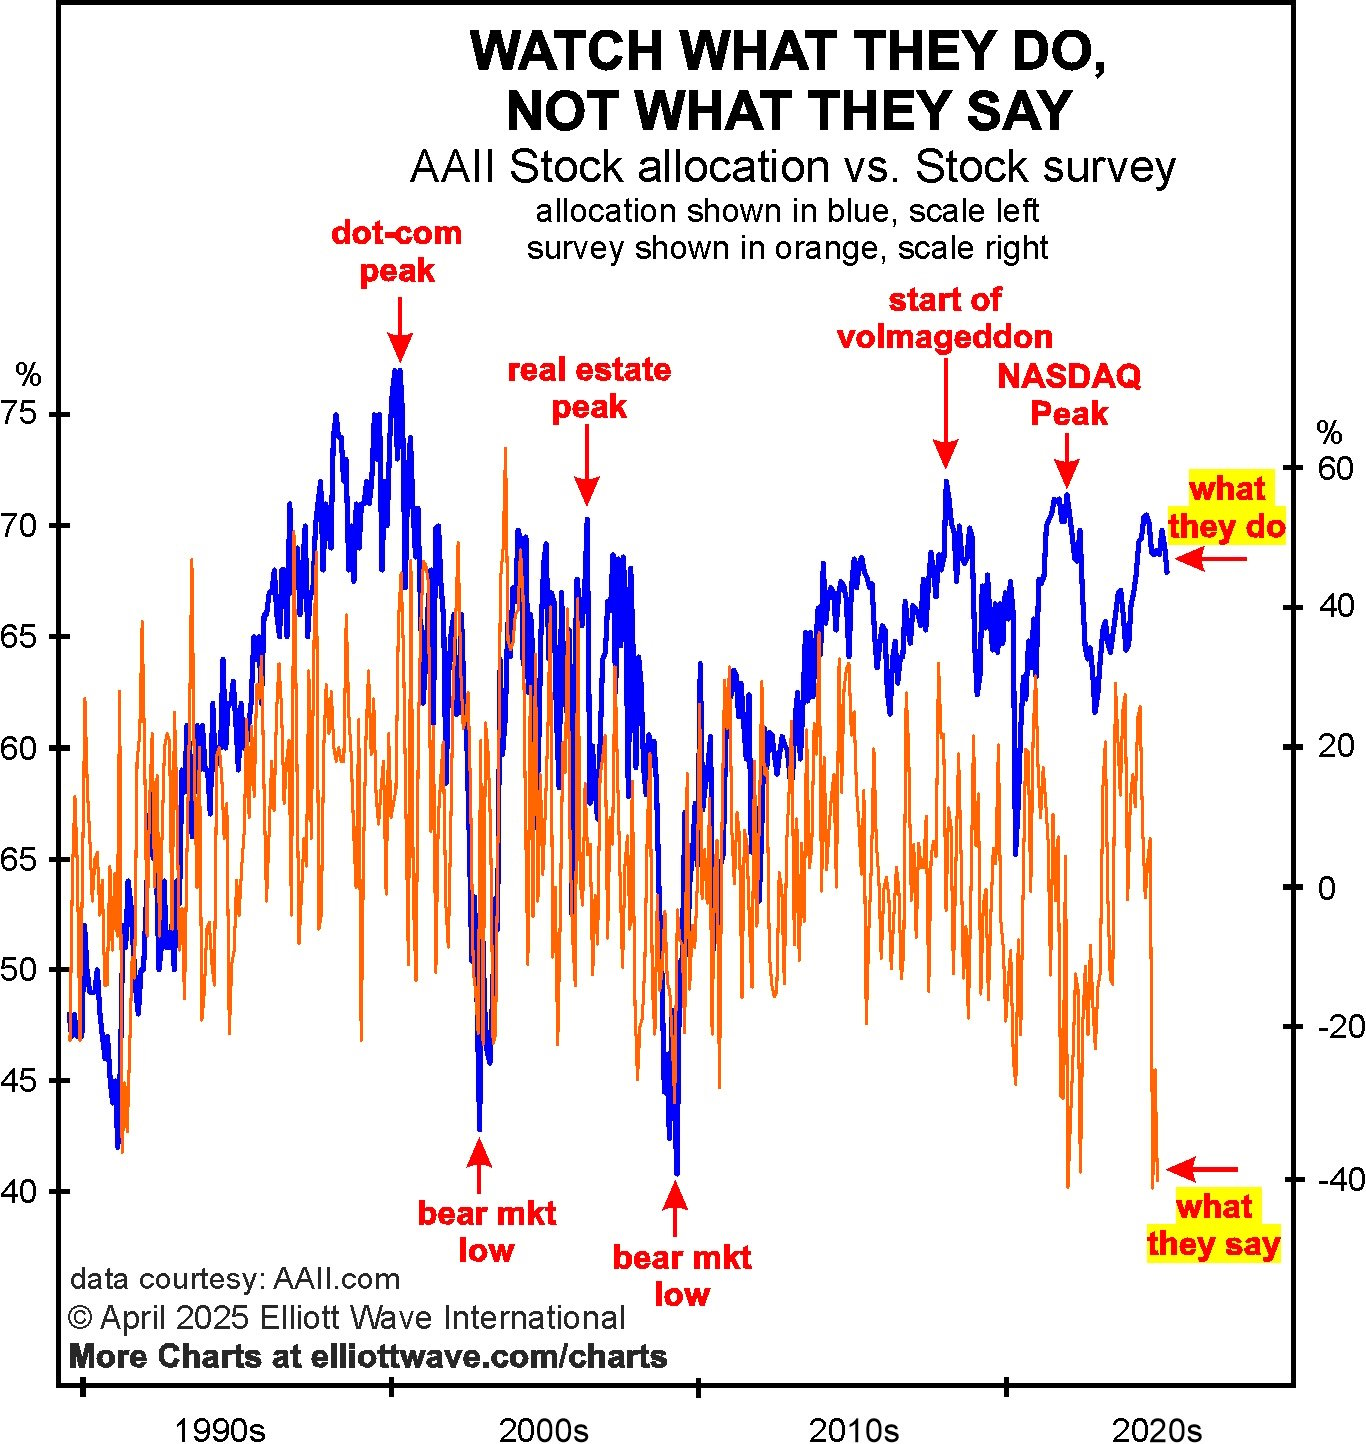
Survey data gathered by the American Association of Individual Investors shows that while investors may place themselves in the bear camp, their actions betray an enthusiasm for stocks. The orange line on the chart below shows that the AAII bull-bear opinion spread dropped to a low of -41.2% at the end of February, historically in “bear market low” territory. Yet the blue line, showing the percentage that AAII members allocate to stocks in their portfolios, reveals what they are doing. The percentage stands at 67.9% as of the end of February, which, as the chart shows, is a historically high level. At the bear market lows in October 2002 and March 2009, the percentage that members allocated to stocks was 42.8% and 40.8%, respectively:
This is a precarious imbalance as investors will eventually align their portfolios with their opinions, just as they did during the prior bear markets in 2000-2002 and 2007-2009. The more liberal use of leverage at this peak simply amplifies the dynamic, which was unprecedented at the S&P’s all-time high in February.
The Elliott wave model reflects the repetitive patterns of market behavior. Hence, it helps you to anticipate what investors will do next. Get our latest detailed Elliott wave analysis of the U.S. stock market, as well as other major financial markets, by clicking on the button below.
Would you like to delve into the details of Elliott wave analysis – FREE? You may do so by accessing the online version of Frost & Prechter’s Wall Street bestseller, Elliott Wave Principle: Key to Market Behavior, now.