Just how extreme have valuations gotten? Read this excerpt:
The chart below updates our history of year-end valuations for stocks of S&P companies on two bases: price to book value (Y axis) and dividend yield (X axis). I thought the year-end 2021 overvaluation would never be surpassed. But as you can see, the year-end 2024 reading is both higher and further to the right. It is the highest multiple ever recorded for S&P Industrials’ price to book value and the fifth-lowest level for the S&P Composite’s dividend yield, the four lower readings all occurring in 1998-2001:
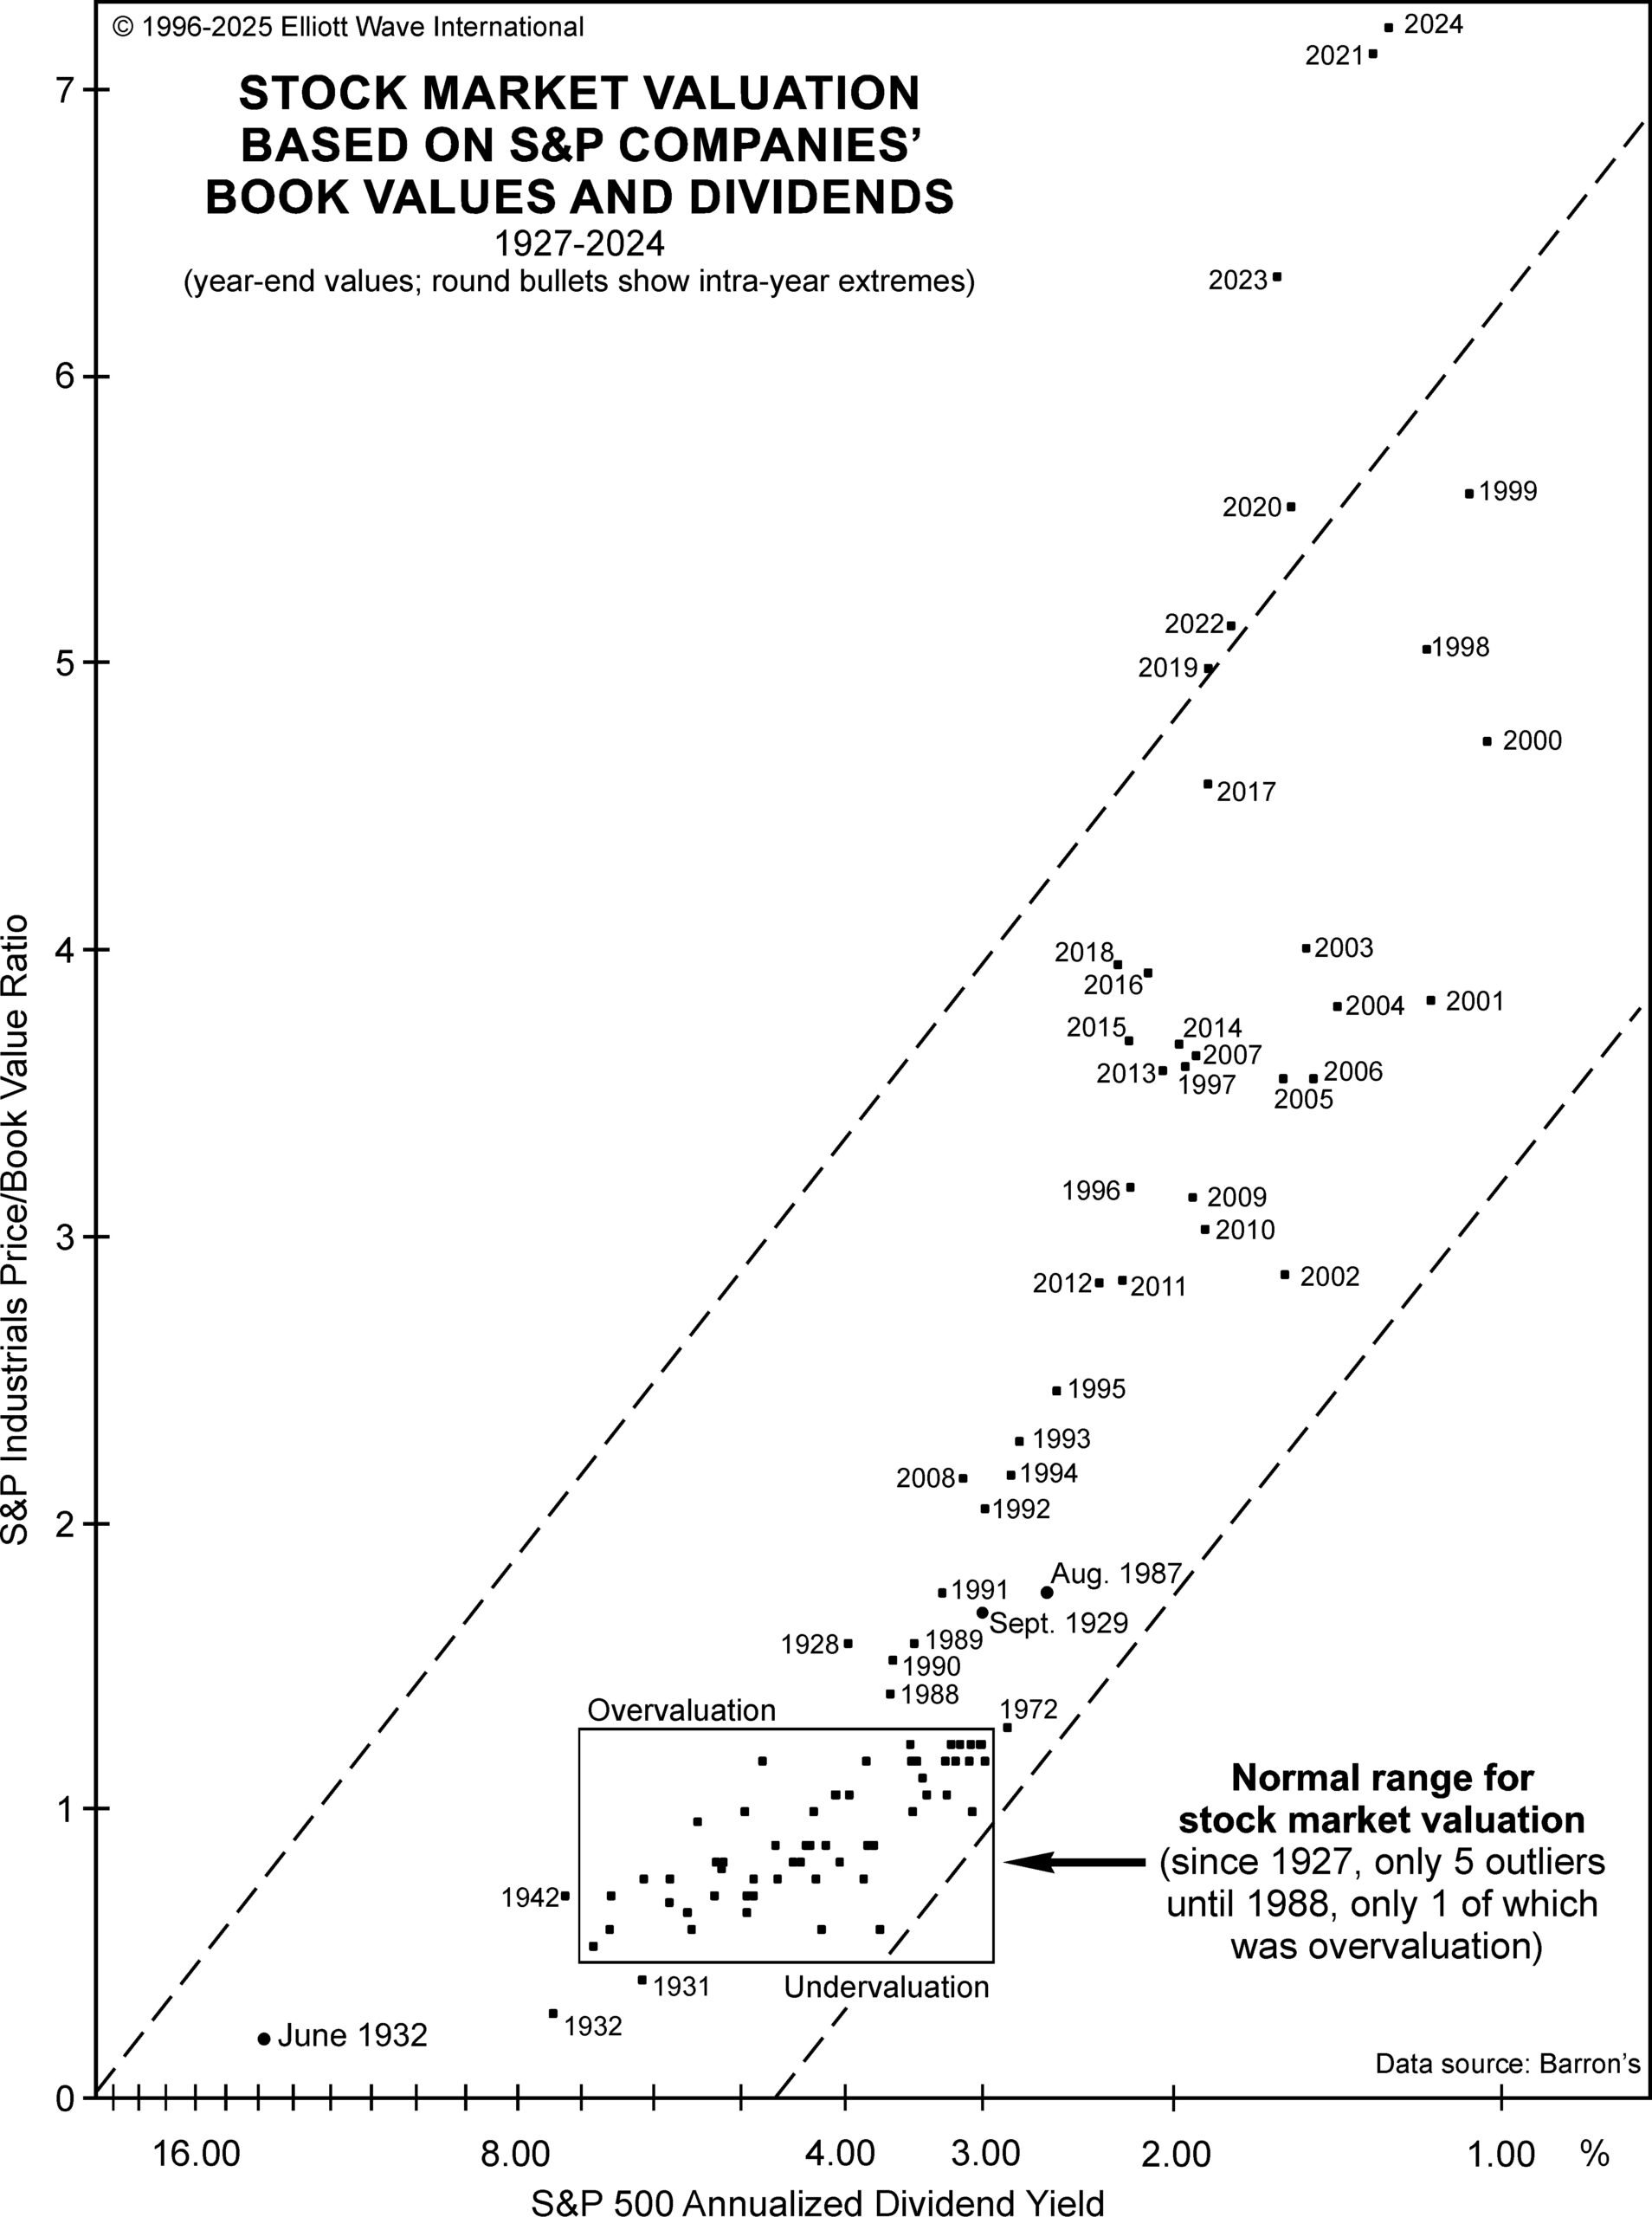
The extreme readings of 1998-2001 stayed within the dashed-line channel, but the past six years’ closing valuations are all beyond it. In three of those years — 2021, 2023 and 2024 — price to book value was above that of 1999, the year of the all time high in stock indexes priced in real money (gold).
You will never find charts and analysis like this in mainstream financial publications. Find out what you’ve been missing by tapping into the insights of our latest Elliott Wave Theorist by clicking on the button below.
Want to see more cool charts like this – FREE? Follow this link for instant access.