In July 2008, Crude Oil made history.
So did we.
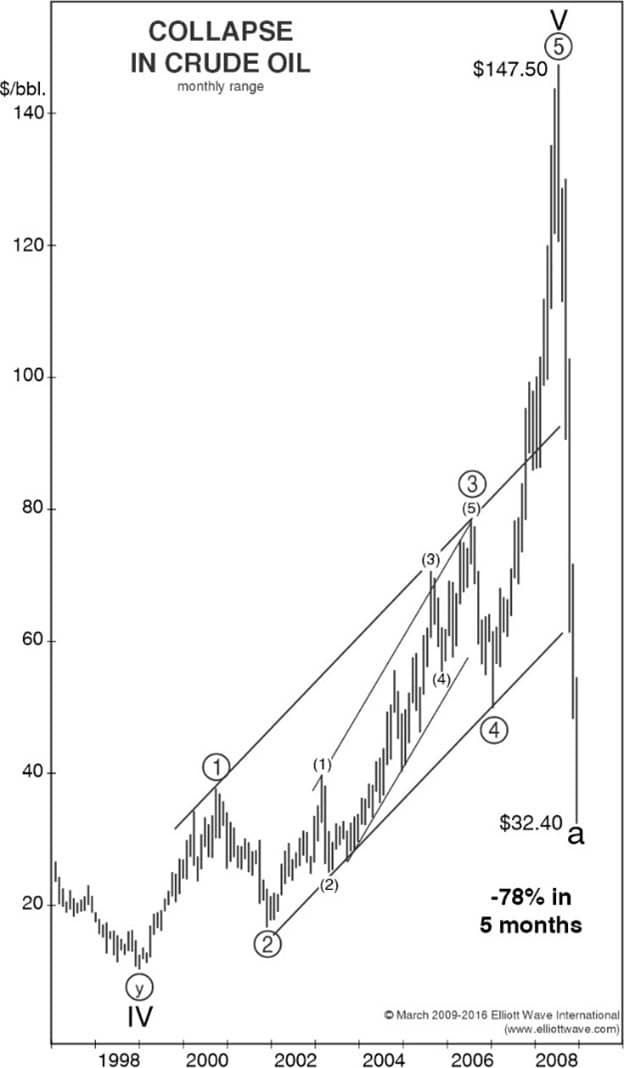
That’s when the price of one barrel reached its highest price in history. It never traded higher before or since.
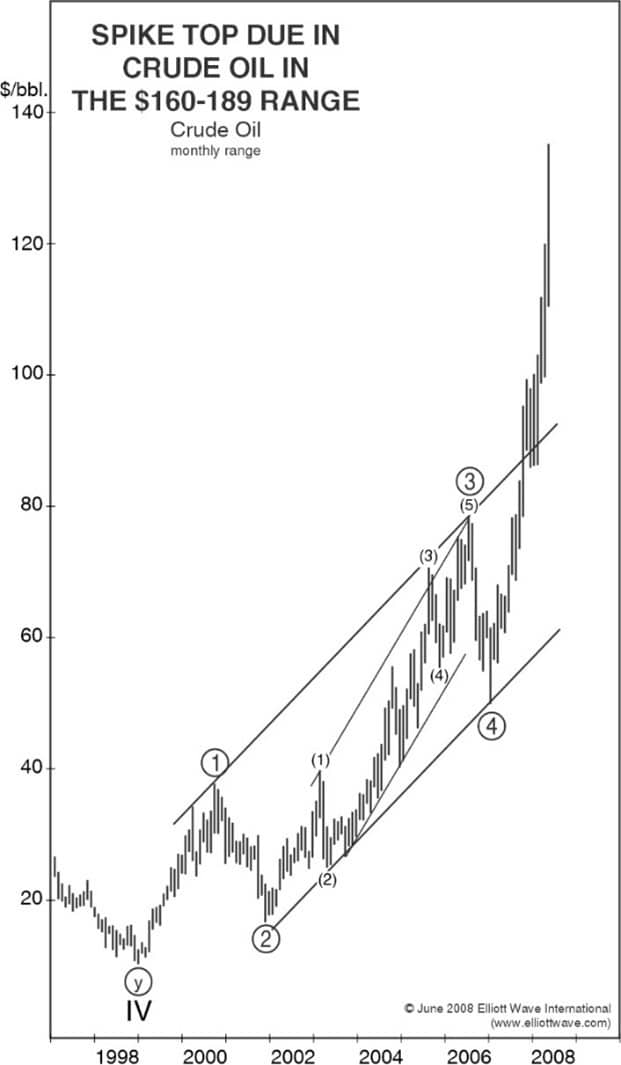
As oil was soaring in the fifth wave of a decade-long uptrend, 97% of analysts were bullish. Commentators and economists announced there was a shortage of oil and called for $200 a barrel. But a full month before crude’s peak, on June 8, 2008, The Elliott Wave Theorist warned subscribers:
“…one of the greatest commodity tops of all time is due very soon.“
On July 11, 2008, oil hit its final high and shocked the world with a breathtaking 78% crash in 5 months.
Like all freely traded markets, energy markets reliably flash Elliott wave setups on time frames from intraday to monthly and longer. Find out what setups are occurring now.
You have 2 ways to benefit from our energy market coverage:
- For monthly updates on crude, Brent, NatGas and energy ETFs along with other worldwide markets, subscribe to our flagship monthly publication, Global Market Perspective. $77/mo.
- For intensive intraday, daily and weekly analysis of crude, Brent, NatGas and energy ETFs, subscribe to our Energy Pro Service. $267/mo.
Here’s what readers say:
- “I want to thank you so very much for the great daily and weekly Elliott wave information you give on oil and natural gas. I find this information to be extremely helpful.”
- “You have a great Pro Service!!! Your service works perfect. English is not my mother tongue, but the guys are speaking clearly in their videos, so it’s easy to understand.”
- “I find this Pro Service extremely helpful in my decision making process.”
Not ready to subscribe?
Get the latest issue and decide if you like us.
OR:
Join Club Elliott Wave to receive numerous benefits for only $2 a month.