Channeling
Key Takeaway: A properly drawn Elliott wave trend channel typically marks the upper and lower boundaries of an impulse wave. Channeling will help you identify price targets and realize how future trends could develop. Elliott channels are most useful in identifying targets for wave four and five.
Elliott noted that a parallel trend channel typically marks the upper and lower boundaries of an impulse wave, often with dramatic precision. You should draw one as early as possible to assist in determining wave targets and provide clues to the future development of trends.
How to Draw a Channel
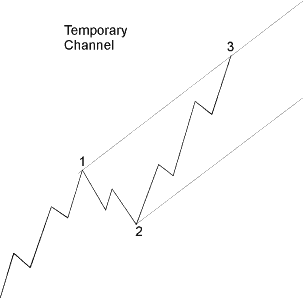
The initial channeling technique for an impulse requires at least three reference points. When wave three ends, connect the points labeled 1 and 3, then draw a parallel line touching the point labeled 2, as shown in Figure 1.

This construction provides an estimated boundary for wave four. (In most cases, third waves travel far enough that the starting point is excluded from the final channel’s touch points.)
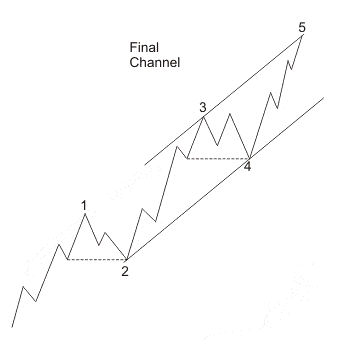
If the fourth wave ends at a point not touching the parallel, you must reconstruct the channel in order to estimate the boundary for wave five. First connect the ends of waves two and four. If waves one and three are normal, the upper parallel most accurately forecasts the end of wave five when drawn touching the peak of wave three, as in Figure 2.

If wave three is abnormally strong, almost vertical, then a parallel drawn from its top may be too high. Experience has shown that a parallel to the baseline that touches the top of wave one is then more useful. In some cases, it may be useful to draw both potential upper boundary lines to alert you to be especially attentive to the wave count and volume characteristics at those levels and then take appropriate action as the wave count warrants.
Always remember that all degrees of trend are operating at the same time. Sometimes, for instance, a fifth wave of Intermediate degree within a fifth wave of Primary degree will end when it reaches the upper channel lines at both degrees simultaneously. Or sometimes a throw-over at Supercycle degree will terminate precisely when prices reach the upper line of the channel at Cycle degree.
Zigzag corrections often form channels with four touch points. One line connects the starting point of wave A and then end of wave B; the other line touches the end of wave A and end of wave C. Once the former line is established, a parallel line drawn from the end of wave A is an excellent tool for recognizing the exact end of the entire correction.
“So wait… I can really learn to predict the markets?”

Yes. Markets aren’t rational. For every action, there isn’t always an equal and opposite reaction.
What drives prices isn’t logic, but emotion. Market emotions unfold in predictable patterns called Elliott waves. That’s what makes prices predictable.
What you just read is from the Wall Street bestseller, “Elliott Wave Principle: Key to Market Behavior.” For 40+ years, it’s been a top-shelf book on unbiased market analysis.
Amazon reviewers call it “classic and essential” and ” the bible of the theory.” Now, you can get instant, FREE access to the full online version of this book ($29 value).