Flats
Key Takeaway: A flat is a sideways correction labeled A-B-C. It subdivides 3-3-5.
A flat correction differs from a zigzag in that the subwave sequence is 3-3-5, as shown in Figures 1 and 2. Since the first actionary wave, wave A, lacks sufficient downward force to unfold into a full five waves as it does in a zigzag, the B wave reaction, not surprisingly, seems to inherit this lack of countertrend pressure and terminates near the start of wave A. Wave C, in turn, generally terminates just slightly beyond the end of wave A rather than significantly beyond as in zigzags.
Bull Market Flats
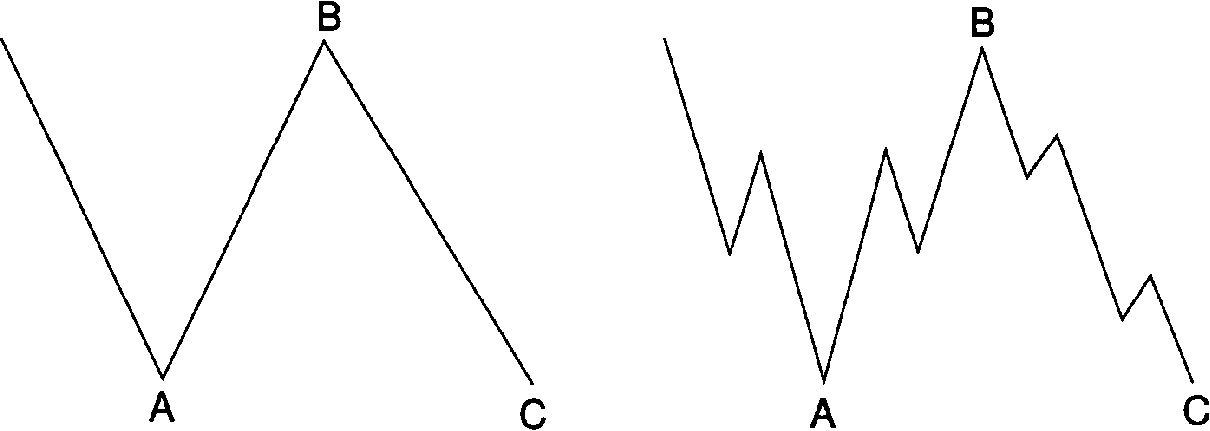
Figure 1 | Figure 2
In a bear market, the pattern is the same but inverted, as shown in Figures 3 and 4.
Bear Market Flats
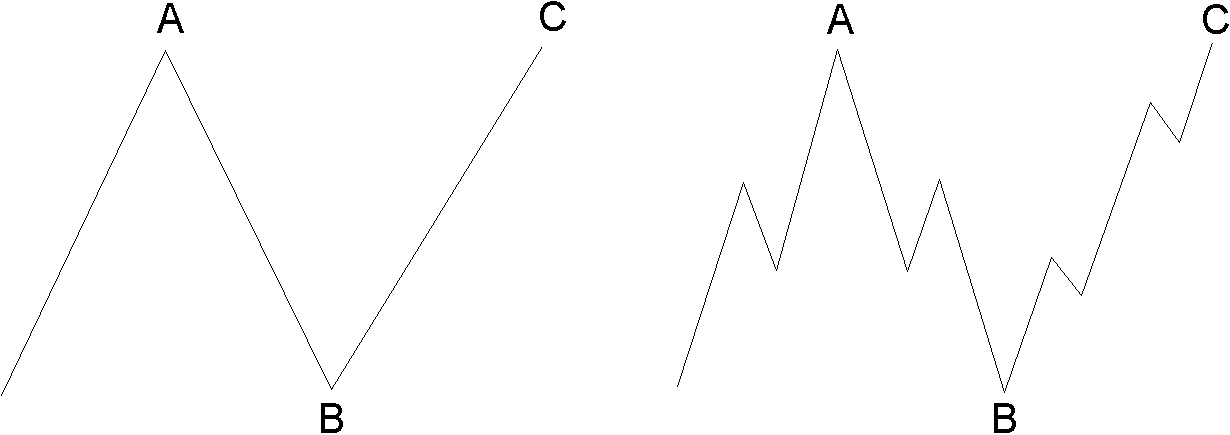
Figure 3 | Figure 4
A flat correction usually retraces less of the preceding impulse wave than does a zigzag. It tends to occur when the larger trend is strong, so it virtually always precedes or follows an extension. The more powerful the underlying trend, the briefer the flat tends to be. Within an impulse, the fourth wave frequently sports a flat, while the second wave rarely does.
What might be called a “double flat” does occur. However, Elliott categorized such a formation as a “double three,” a term we discuss under “Combinations.”
Types of Flats
The word “flat” is used as a catch-all name for any A-B-C correction that subdivides 3-3-5. In Elliott literature, however, three types of 3-3-5 corrections have been named by differences in their overall shape.
Regular Flat
In a regular flat correction, wave B terminates about at the level of the beginning of wave A, and wave C terminates a slight bit past the end of wave A, as we have shown in Figures 1 through 4.
Expanded Flat
Far more common, however, is the variety we call an expanded flat, which contains a price extreme beyond that of the preceding impulse wave. Elliott called this variation an “irregular” flat, although the word is inappropriate as they are actually far more common than “regular” flats.
In expanded flats, wave B of the 3-3-5 pattern terminates beyond the starting level of wave A, and wave C ends more substantially beyond the ending level of wave A, as shown for bull markets in Figures 5 and 6 and bear markets in Figures 7 and 8.
Bull Market Expanded Flats
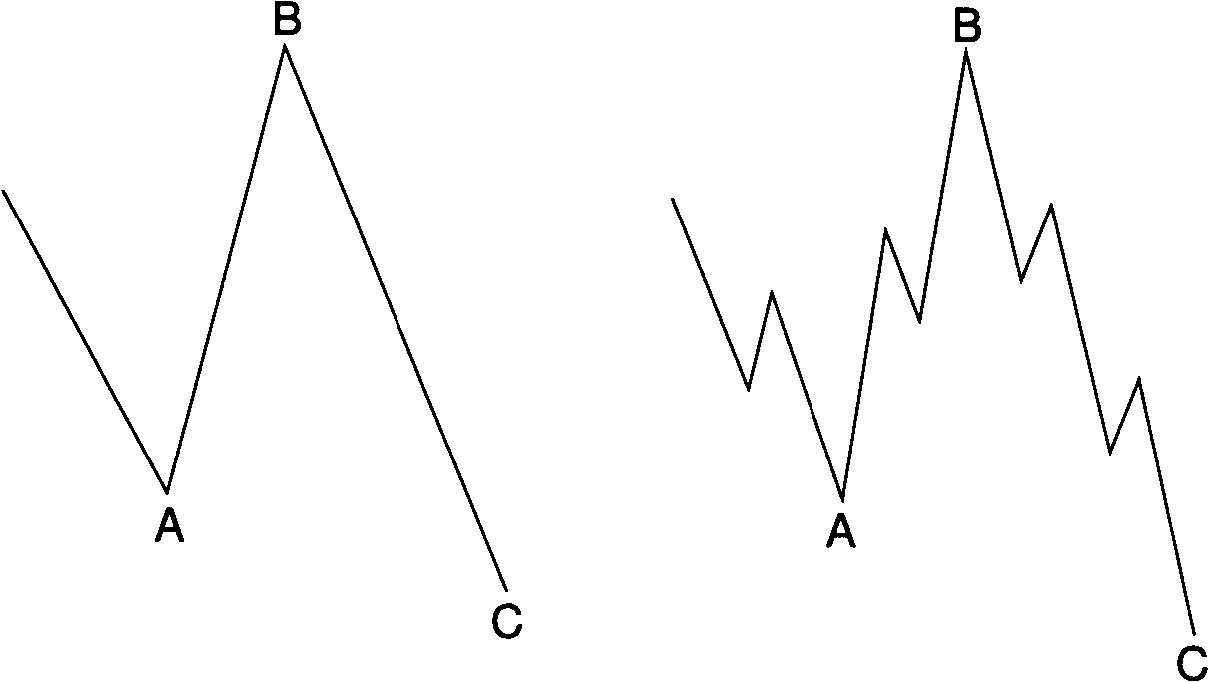
Figure 5 | Figure 6
Bear Market Expanded Flats
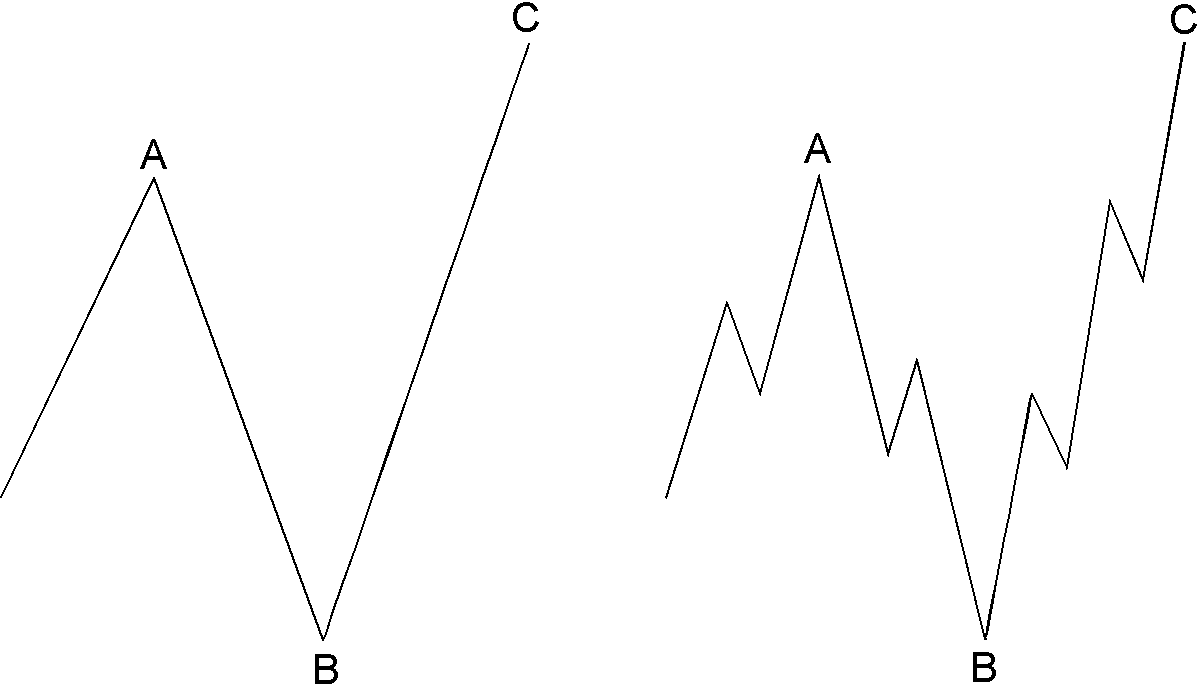
Figure 7 | Figure 8
The formation in the DJIA from August to November 1973 was an expanded flat correction in a bear market, or an “inverted expanded flat” (see Figure 9).
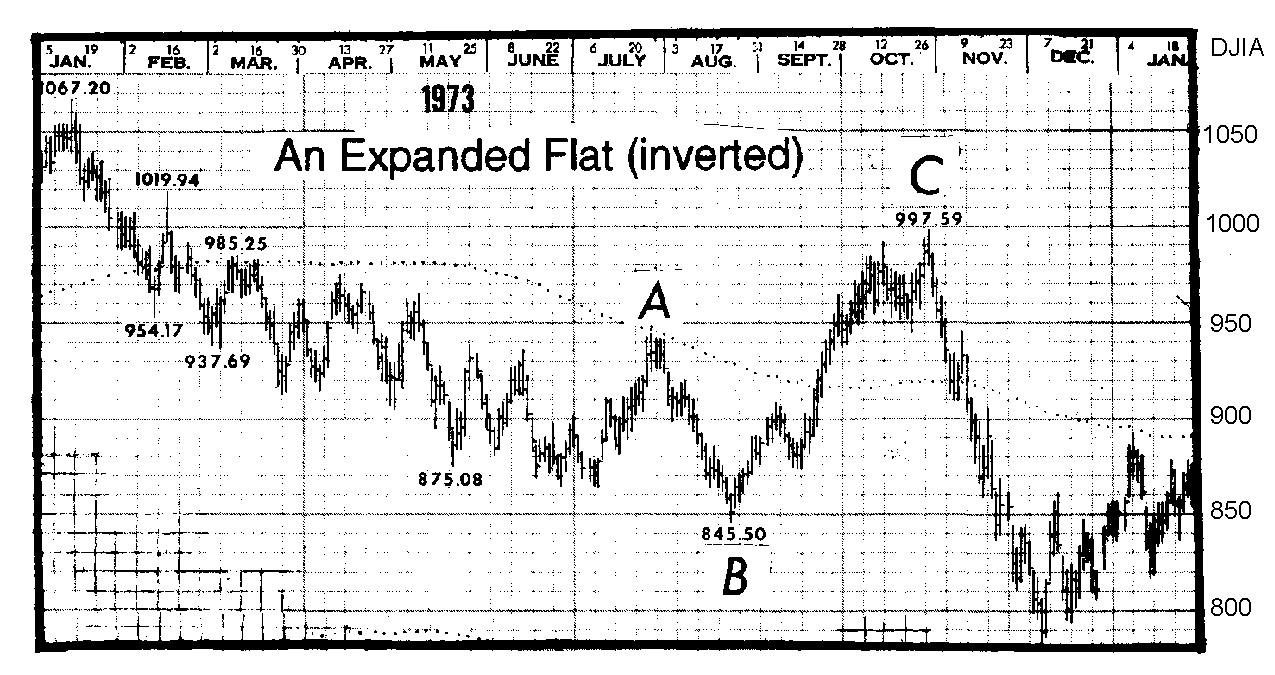
Figure 9
Running Flat
In a rare variation on the 3-3-5 pattern, which we call a running flat, wave B terminates well beyond the beginning of wave A as in an expanded flat, but wave C fails to travel its full distance, falling short of the level at which wave A ended, as in Figures 10 through 13.
Bull Market Running Flats
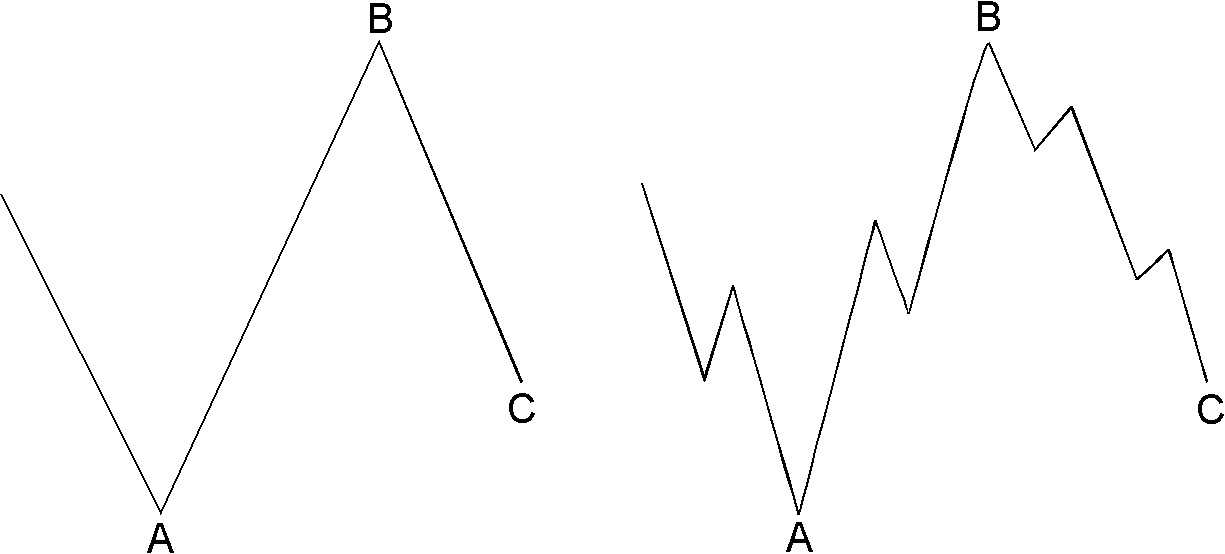
Figure 10 | Figure 11
Bear Market Running Flats
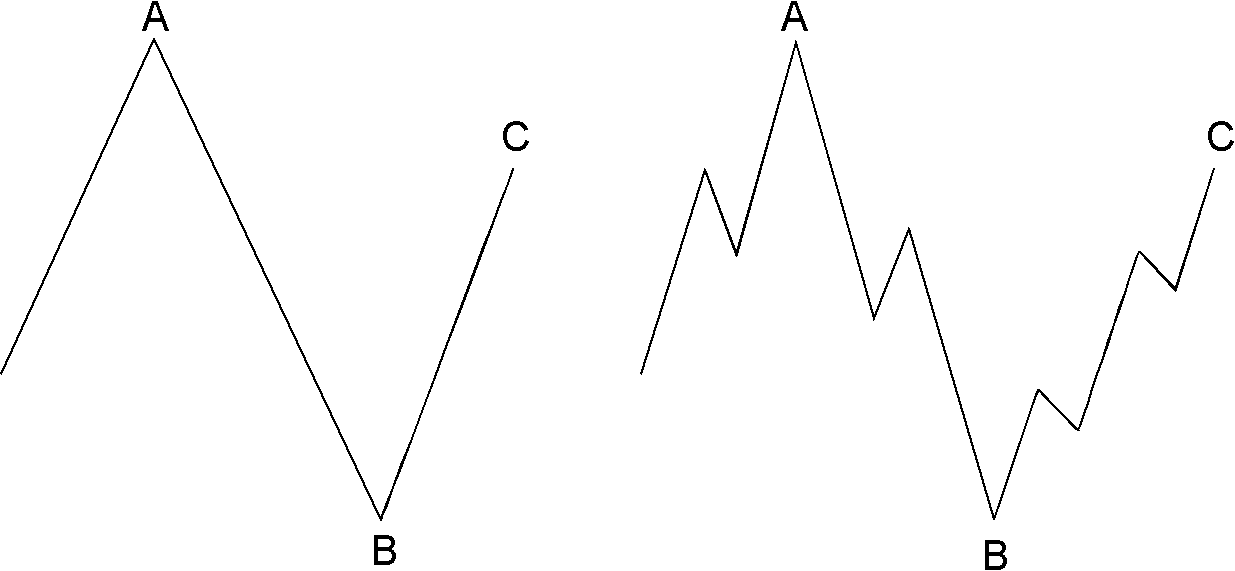
Figure 12 | Figure 13
Apparently in this case, the forces in the direction of the larger trend are so powerful that the pattern is skewed in that direction. The result is akin to the truncation of an impulse.
It is always important, but particularly when concluding that a running flat has taken place, that the internal subdivisions adhere to Elliott’s rules. If the supposed B wave, for instance, breaks down into five waves rather than three, it is more likely the first wave up of the impulse of next higher degree. The power of adjacent impulse waves is important in recognizing running corrections, which tend to occur only in strong and fast markets.
We must issue a warning, however. There are hardly any examples of this type of correction in the price record. Never label a correction prematurely this way, or you’ll find yourself wrong nine times out of ten. A running triangle, in contrast, is much more common.
“So wait… I can really learn to predict the markets?”

Yes. Markets aren’t rational. For every action, there isn’t always an equal and opposite reaction.
What drives prices isn’t logic, but emotion. Market emotions unfold in predictable patterns called Elliott waves. That’s what makes prices predictable.
What you just read is from the Wall Street bestseller, “Elliott Wave Principle: Key to Market Behavior.” For 40+ years, it’s been a top-shelf book on unbiased market analysis.
Amazon reviewers call it “classic and essential” and ” the bible of the theory.” Now, you can get instant, FREE access to the full online version of this book ($29 value).