Zigzags
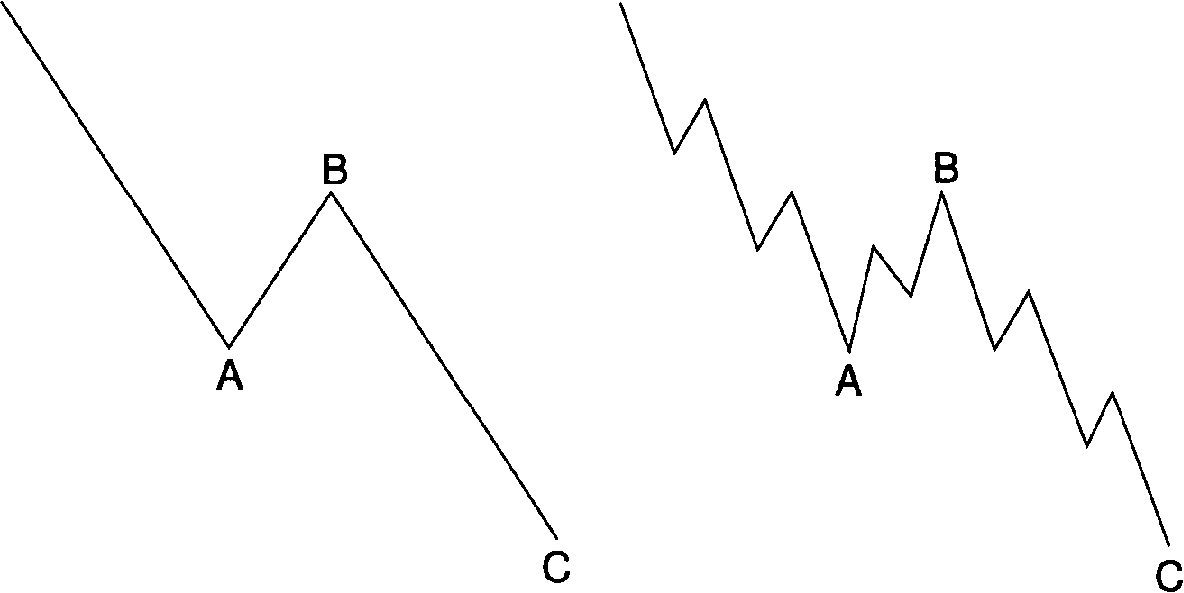
Key Takeaway: A zigzag is a sharp correction, labeled A-B.C. It subdivides 5-3-5.
Single Zigzag
A single zigzag in a bull market is a simple three-wave declining pattern labeled A-B-C. The subwave sequence is 5-3-5, and the top of wave B is noticeably lower than the start of wave A, as illustrated in Figures 1 and 2.
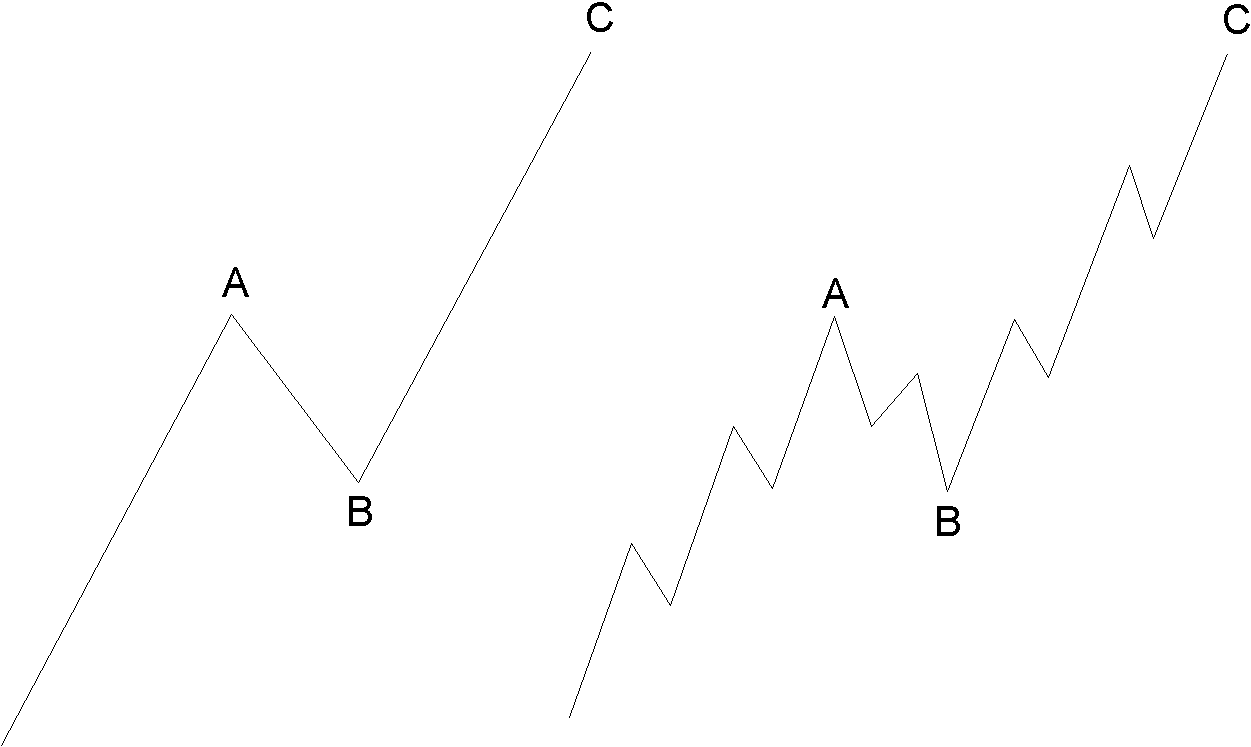
In a bear market, a zigzag correction takes place in the opposite direction, as shown in Figures 3 and 4. For this reason, a zigzag in a bear market is often referred to as an inverted zigzag.
Double and Triple Zigzags
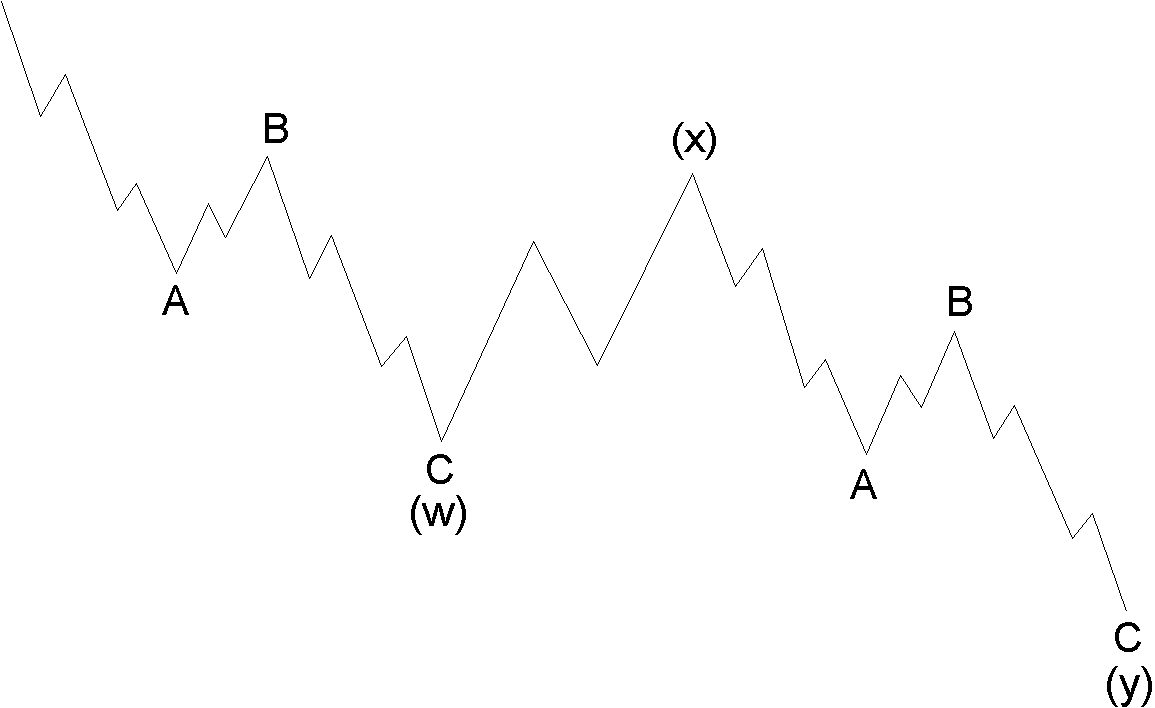
Occasionally zigzags will occur twice, or at most, three times in succession, particularly when the first zigzag falls short of a normal target. In these cases, each zigzag is separated by an intervening “three,” producing what is called a double zigzag (see Figure 5) or triple zigzag. These formations are analogous to the extension of an impulse wave but are less common.
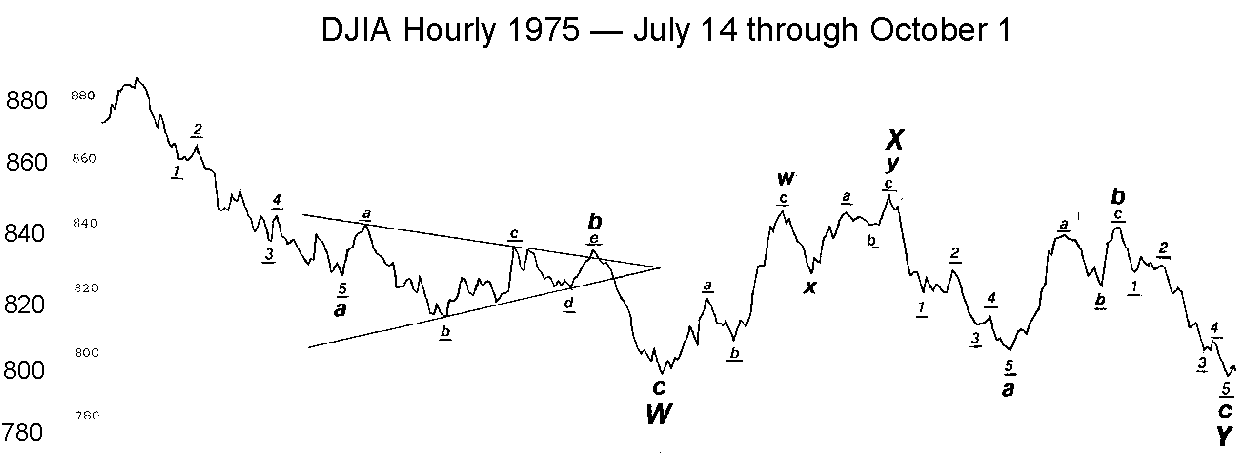
The correction in the Dow Jones Industrial Average from July to October 1975 (see Figure 6) can be labeled as a double zigzag, as can the correction in the Standard and Poor’s 500 stock index from January 1977 to March 1978 (see Figure 7). Within impulses, second waves frequently sport zigzags, while fourth waves rarely do.
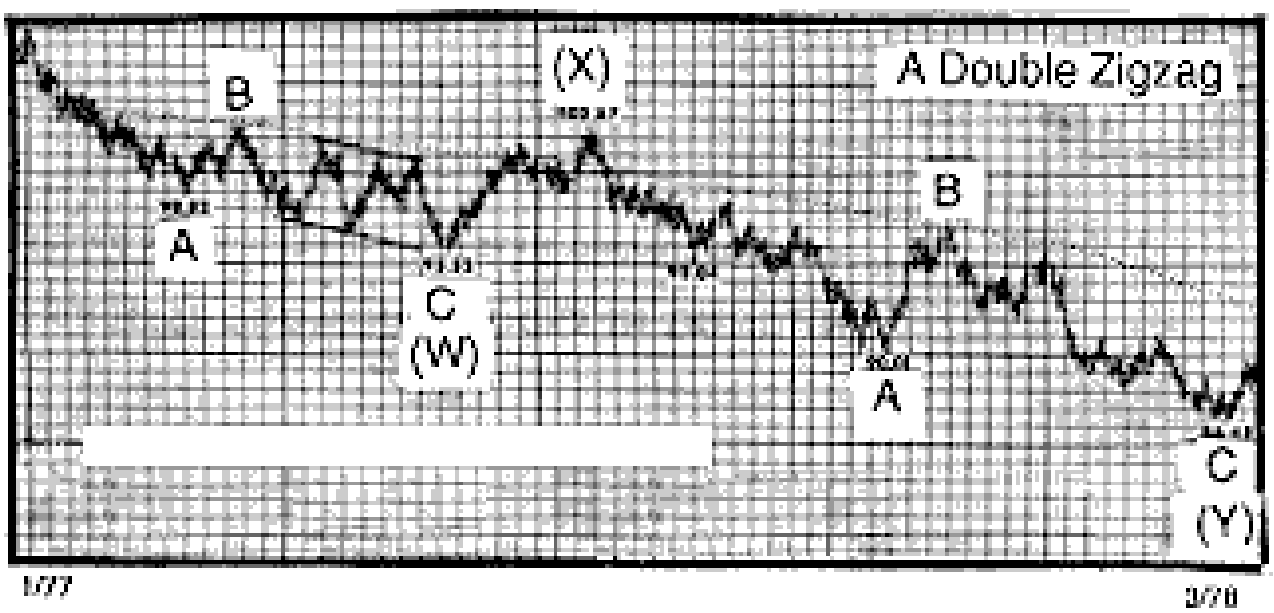
R.N. Elliott’s original labeling of double and triple zigzags and double and triple threes (see “Combinations” entry) was a quick shorthand. He denoted the intervening movements as wave X, so that double corrections were labeled A-B-C-X-A-B-C. Unfortunately, this notation improperly indicated the degree of the actionary subwaves of each simple pattern. They were labeled as being only one degree less than the entire correction when in fact, they are two degrees smaller. We have eliminated this problem by introducing a useful notational device: labeling the successive actionary components of double and triple corrections as waves W, Y and Z, so that the entire pattern is counted “W-X-Y (-X-Z).” The letter W now denotes the first corrective pattern in a double or triple correction, Y the second, and Z the third of a triple. Each subwave thereof (A, B or C, as well as D or E of a triangle) is now properly seen as two degrees smaller than the entire correction. Each wave X is a reactionary wave and thus always a corrective wave, typically another zigzag.
“So wait… I can really learn to predict the markets?”

Yes. Markets aren’t rational. For every action, there isn’t always an equal and opposite reaction.
What drives prices isn’t logic, but emotion. Market emotions unfold in predictable patterns called Elliott waves. That’s what makes prices predictable.
What you just read is from the Wall Street bestseller, “Elliott Wave Principle: Key to Market Behavior.” For 40+ years, it’s been a top-shelf book on unbiased market analysis.
Amazon reviewers call it “classic and essential” and ” the bible of the theory.” Now, you can get instant, FREE access to the full online version of this book ($29 value).